Barron’s completed its 2019 Barron’s Roundtable where they asked 10 of Wall Street’s smartest investors for their 48 best investment ideas. We’ve gone through the list and narrowed it down to five specific stocks that are the best to buy right now. The five stocks that we’re going to look at were recommendations from Oscar Shafer, Mario Gabelli, Scott Black and Rupal Bhansali. As part of the analysis, we’re going to summarize the analysis done by these experts and provide our own analysis of their picks. Let’s get started with the list.
1. Dollar Tree Inc (DLTR)—Oscar Schafer, Chairman of Rivulet Capital
Business Summary
Dollar Tree, Inc. operates over 15,000 discount variety retail stores in the United States and Canada. It operates through two segments, Dollar Tree and Family Dollar. It was founded in 1986 and is headquartered in Chesapeake, Virginia.
Expert’s View
Oscar Shafer pointed to the company’s consistent growth model that has kept them on a growth trajectory for over three decades. They acquired Family Dollar in 2015 and sought to stabilize that business and turn it around. He drew attention to the fact that DLTR has been paying down debt and are in a position to start ramping up investment in Family Dollar. The Dollar Tree business accounts for over 80% of consolidated operating income and since the previous financial crisis has over doubled the number of stores. Along with increasing the store count, they have been able to increase same store sales growth by 4.1% and has grown operating income at a compound annual growth rate of 15%. His recommendation is also due to the price falling to a level in which the Dollar Tree brand is trading at a fair price and he feels like he’s getting Family Dollar for free.
Our View
Earnings: For the past 5 years DLTR has generated an average revenue per share growth rate of 27.7%, which is above the median growth rate for the last 13-years of 17.35%. Earnings growth over the same period has been 15.7%, which is in-line with its 13-year median value of 15.95%. This rate of growth is consistent with Mr. Shafer’s assessment of a strong history of growing earnings.
Management Effectiveness: From a management effectiveness perspective, DLTR is posting an impressive ROE of 24.23% for the trailing 12 months and is close to its 13-year median value of 27.39%. Its ROE is supported by a high Net Profit Margin of 7.64%, which is toward the higher end of its historical range and is higher than 89% of companies in its industry.
Valuation: From a valuation perspective, the current price for DLTR is a relative value. Factoring in its projected earnings growth rate, the PEG ratio for DLTR is trading at 0.71. This means that the P/E is trading below the projected earnings growth rate for this company and is below its 13-year median value of 1.07. The current EV/EBITDA is 10.54, which values below 10 are generally considered a value stock. Its current P/B is trading at 2.42, which is nearly half that of its 13-year median value of 4.22. From a valuation perspective, the company is trading at a discount to historical levels.
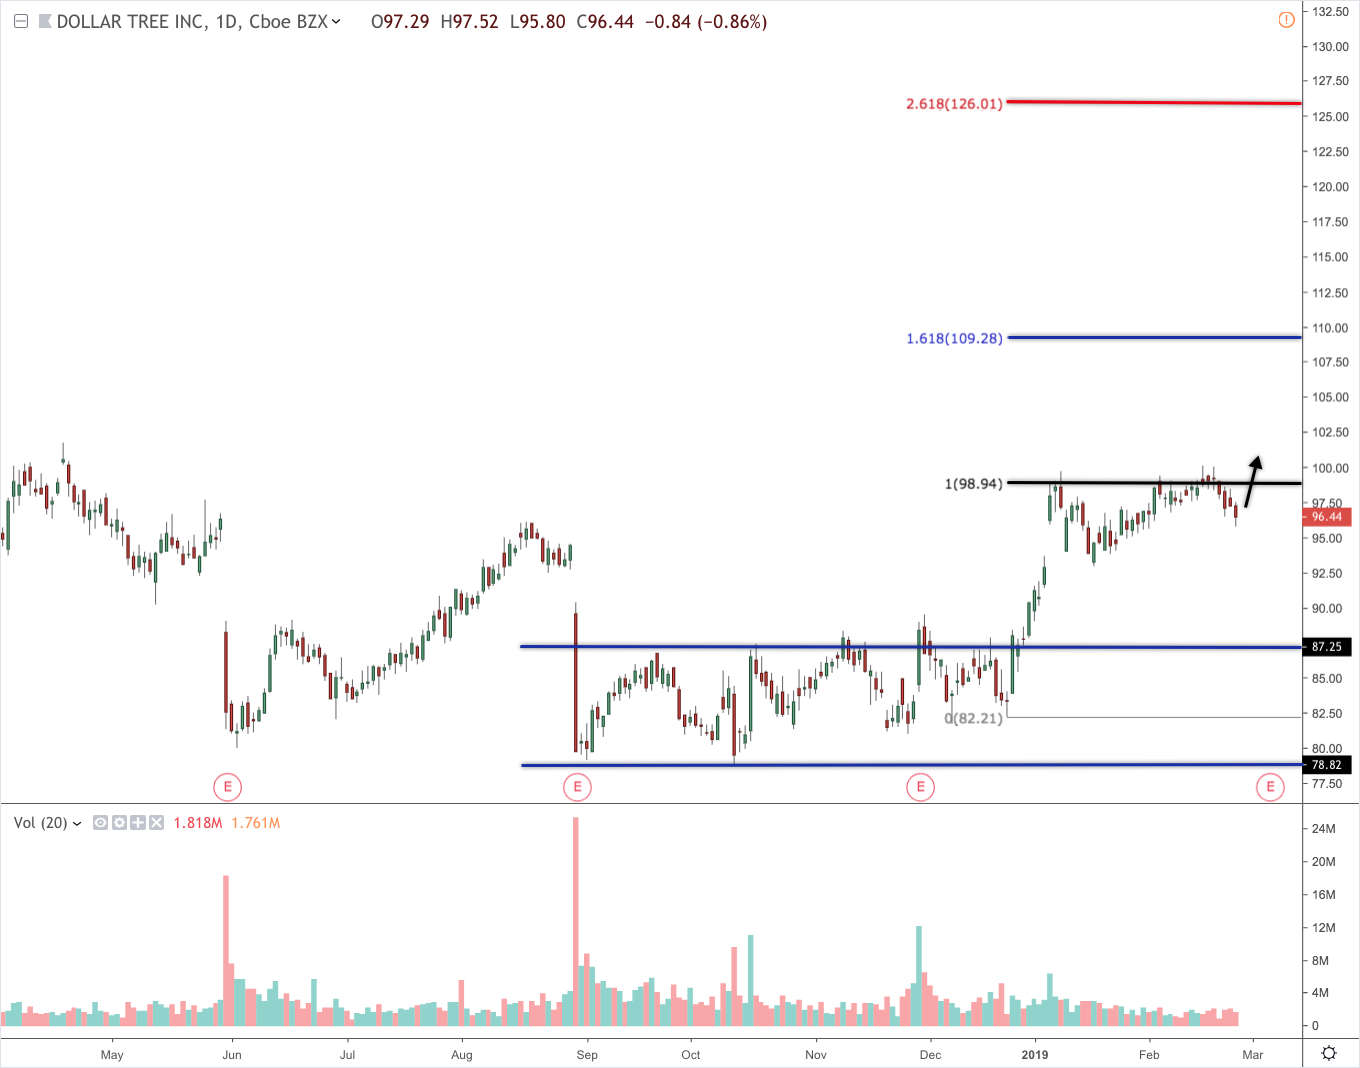
Technicals: After falling to its lowest price level since mid-2017 in September, DLTR began to consolidate before breaking out in late December 2018. The bottoming formation was a rectangle pattern that would have yielded a price target near where the stock is trading now. Based on the size of the initial wave in the last week of December to the first week of January, it produces a projected target of $110 at the 161.8% level and over $125 at the 261.8% level. The price is currently consolidating and a breakout above $100 would help confirm that type of potential price movement.
2. Energizer Holdings (ENR)-Mario Gabelli, Chairman and CEO of Gamco Investors
Business Summary
Energizer Holdings, Inc., together with its subsidiaries, manufactures, markets, and distributes household batteries, specialty batteries, and lighting products worldwide. Energizer Holdings, Inc. is headquartered in St. Louis, Missouri.
Expert’s View
Mario Gabelli was impressed with the management of the company and the November 2018 announcement of their acquisition of Spectrum Brands, a battery and portable lighting business, for $2 billion. As part of the acquisition, ENR will be required to sell Rayovac’s Varta operations and garner about $550 million that business. Some of the most intriguing parts of their acquisition is the $200 million hearing-aid business and the large potential EBITDA growth over the next three years with relatively little capex spending. The growth opportunity will allow them to rapidly pay down the $3 billion in debt they will have as a result of the deal. He estimates that the stock could trade at 18 times estimated earnings of $3.95 per share, or around $67.
Our View
Earnings: For the past 5 years ENR has generated an average revenue per share growth rate of -1.9%, which is above the median growth rate for the last 7-years of -4.35%. Earnings growth over the same period has been 14.9%, and its 3-year EBITDA growth rate is 39.5%. ENR did post negative earnings for the fiscal year 2015. The revenue picture is fairly troubling for ENR, but Mr. Gabelli’s optimism regarding the Spectrum acquisition is the driving force behind this recommendation.
Management Effectiveness: From a management effectiveness perspective, ENR is posting an extraordinary ROE of 234.96% for the trailing 12 months. This value is way above its 13-year median value and is a result of the significant amount of debt that was taken on as a result of the Spectrum deal. Its net profit margin of 5.78% and its ROA of 4.02% is more consistent with its history. However, this analysis will be more accurate of Mr. Gabelli’s view in the coming quarters when the combined business begins to report.
Valuation: From a valuation perspective, ENR looks relatively expensive. Factoring in its projected earnings growth rate, the PEG ratio for ENR is trading at 4.84. This means that the P/E is trading four times the projected earnings growth rate for this company and is higher than 81% of companies in its industry. The current EV/EBITDA is 19.45, which is higher than 74% of companies in its industry and well above its 7-year median value of 13.95. From a valuation perspective, the company is fairly expensive. However, following the sale of Varta and as it begins to pay down some of its debt, the picture will be able to change quickly. However, the potential value is only unlocked with a successful combined company following the merger.
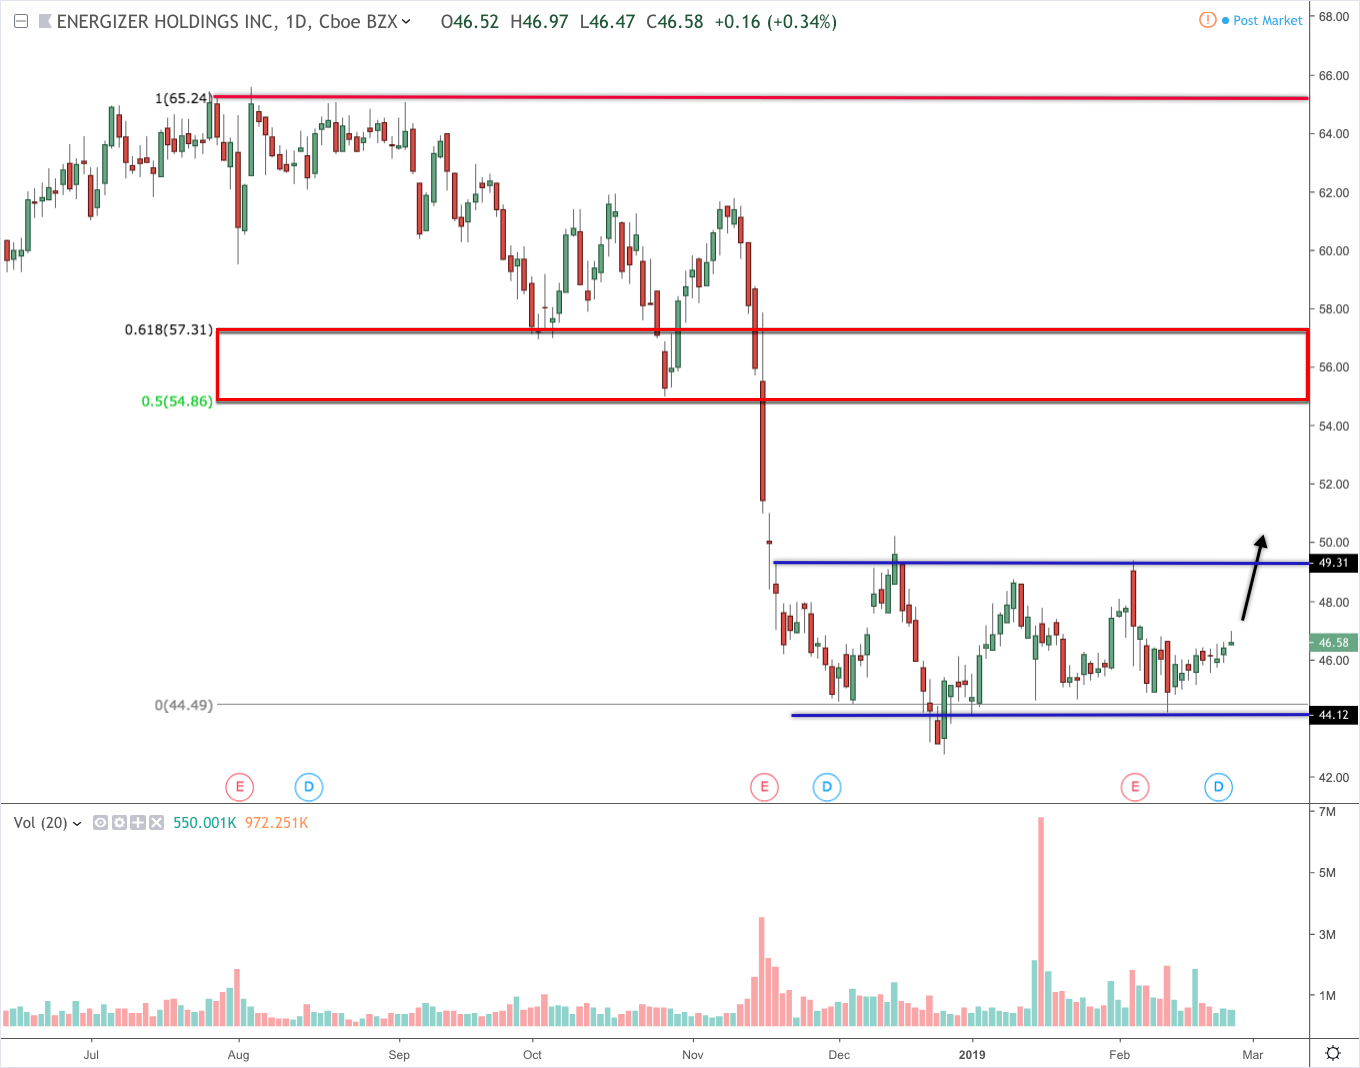
Technicals: ENR is currently trading in a $5 channel near its 3-year low. The stock dropped precipitously following its November earnings, but was able to hold its range after its February 5 report. A breakout above the $49.50 area would provide a $56 price target based on the basing formation. A break of the $57.50 area near the 61.8% Fib retracement level would indicate a full retracement of the downtrend to get near Mr. Gabelli’s target.
3. Abbvie Inc (ABBV)—Scott Black, Founder and President of Delphi Management
Business Summary
AbbVie Inc. discovers, develops, manufactures, and sells pharmaceutical products worldwide. The company offers HUMIRA, a therapy administered as an injection for autoimmune diseases and other medications. The company was incorporated in 2012 and is based in North Chicago, Illinois.
Expert’s View
Simon Black recommended ABBV despite his aversion for suggesting pharmaceutical companies. A continued theme in his discussion of ABBV was the company’s desire to develop products internally rather than through acquisitions. Humira is a $20 billion a year drug for the company and boasts 80% margins. He pointed to the likely 16% increase in revenue year-over-year in 2018 and the company’s forecast to grow earnings at 10% a year through 2020. As a result of the research and development internally, he discussed the pipeline of drugs that are going to be coming onto the market through 2027, including a potential replacement for Humira in 2021. At the time of the roundtable, ABBV was paying a 4.8% dividend yield and generated $9.5 billion in free cash flow through the first nine months of 2018.
Our View
Earnings: For the past 5 years, ABBV has generated an average revenue per share growth rate of 9.1%, which is above the median growth rate for the last 10 years of 7.6%. Earnings growth over the same period has been 5.9%, and its 3-year EPS growth rate is 44.2%. The earnings and revenue growth picture have strengthened in the past several years and analysts are currently projecting a 5-year earnings growth rate of 9.58%. The dividend yield coupled with solid growth prospects makes this stock a strong blend of growth and income.
Management Effectiveness: From a management effectiveness perspective, ABBV is posting an extraordinary ROE of 312.63% for the trailing 12 months. Similar to ENR, its value is way above its 10-year median value and is a result of the significant amount of financial leverage. Its net profit margin of 17.36% and its ROA of 8.44% are consistent with strong growth-oriented levels. The level of debt is a concern if revenue growth or its high margin drugs start to diminish. This will cause debt service to eat into the company’s earnings growth picture.
Valuation: From a valuation perspective, ABBV looks moderately valued. Factoring in its projected earnings growth rate, the PEG ratio for ABBV is trading at 1.38 and its forward P/E is at 9.27. These metrics by themselves are relatively attractive but is based on earnings growth projections. If the analysts forecast for growth begins to stall it will make these measures expensive. The current EV/EBITDA is 20.60, which sits right in the middle of companies in its industry and well above its 7-year median value of 14. A lot is riding on the company’s pipeline that they have internally developed. If these drugs come to market and perform well, the stock easily becomes a compelling value.
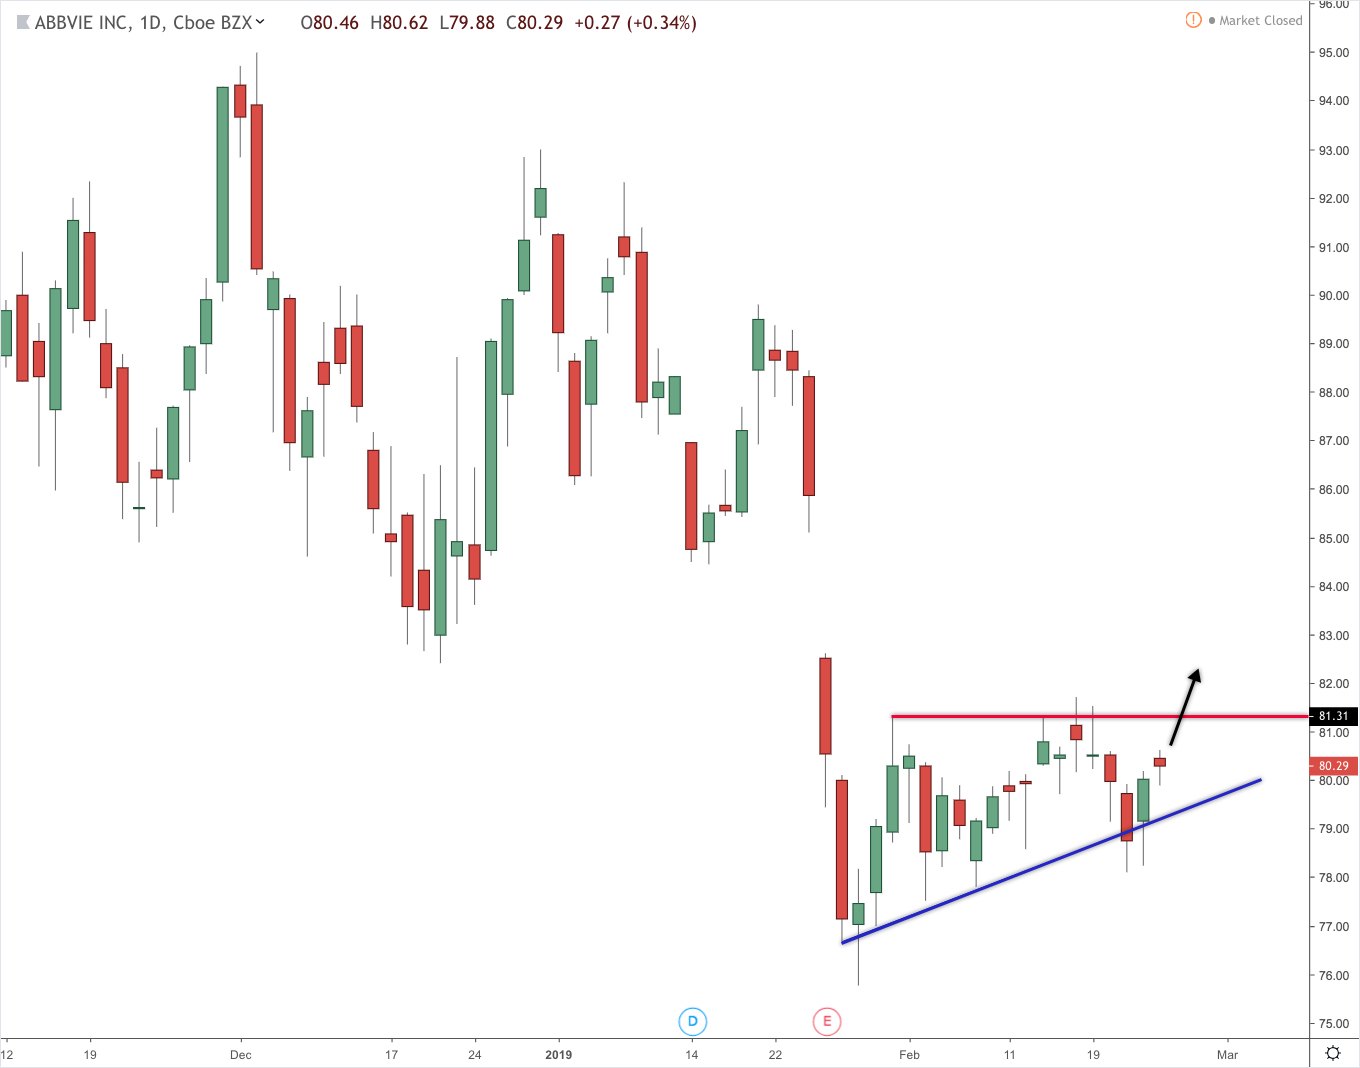
Technicals: The current price is sitting near it’s 2018 low established in late October. The price is currently testing that low following a disappointing earnings announcement on January 25 where they missed analyst’s estimates with their negative earnings result. The price is currently consolidating with a resistance level near $81.50. A close above this level would likely lead the price to fill the earnings gap and trade back around $85. If the earnings picture improves, it would be reasonable for this stock to trade near its 2018 high of $122.
4. China Life Ltd ADR (CHL)—Rupal J. Bhansali, CIO, International & Global, and equities portfolio manager at Ariel Investments
Business Summary
China Mobile Limited, an investment holding company, provides mobile telecommunications and related services in Mainland China and Hong Kong. The company was incorporated in 1997 and is based in Central, Hong Kong. China Mobile Limited is a subsidiary of China Mobile Hong Kong (BVI) Limited.
Expert’s View
Rupal Bhansali’s recommendation of CHL comes despite her overall bearish outlook on China. She made this stock her top pick because of the significant infrastructure costs for telecommunications companies that create a huge barrier of entry for any potential competitors to CHL. They currently have over 900 million subscribers, which is over double that of Verizon Communications (VZ), T-mobile US (TMUS), and Sprint (S) combined. Her analysis of CHL is based on her opinion that telecoms are consumer staples and because CHLs cellular service is just $10 per month. At that price point, subscribers aren’t likely to give up their phones. Since they currently command nearly 67% of the country’s market share, if China places pressure on companies to lower prices they benefit since competitors can’t build out the infrastructure. If they can charge higher prices, it also places them in a win-win situation.
Our View
Earnings: For the past 5 years CHL has generated an average revenue per share growth rate of 2.3%, which is below the median growth rate for the last 10-years of 8.1%. Earnings growth over the same period has been -4.4%, and its 3-year EPS growth rate is -0.50%. It’s median EPS growth rate over the past 13 years is 14%. The earnings picture has deteriorated in the past couple years as growth has slowed. For a company with such a large share of the market, it makes sense that at some point revenue and earnings growth would slow. As an investment, it’s about stability of earnings, cash and collecting the dividend yield of 4.09%. CHL currently has over $60 billion of net cash on its balance sheet.
Management Effectiveness: From a management effectiveness perspective, CHL is posting a ROE of 11.78% for the trailing 12 months. Because of its recent earnings weakness, the ROE is well below its 13-year median value of 17.31%. Its net profit margin is 15.78%, which is higher than 82% of companies in its industry. The current ROA of 7.67% is below its 13-year median value of 11.38%.
Valuation: From a valuation perspective, CHL is trading at an attractive price. The current EV/EBITDA is 3.12, which is lower than 95% of companies in its industry. However, that is mostly in-line with its 13-year median value of 4.00. Its current P/B ratio is 1.35, which is below its 13-year median value of 1.86 and lower than 75% of the companies in its industry. While CHL typically doesn’t trade at high valuations, even trading near median values suggests a price that is over 25% higher than its current price.
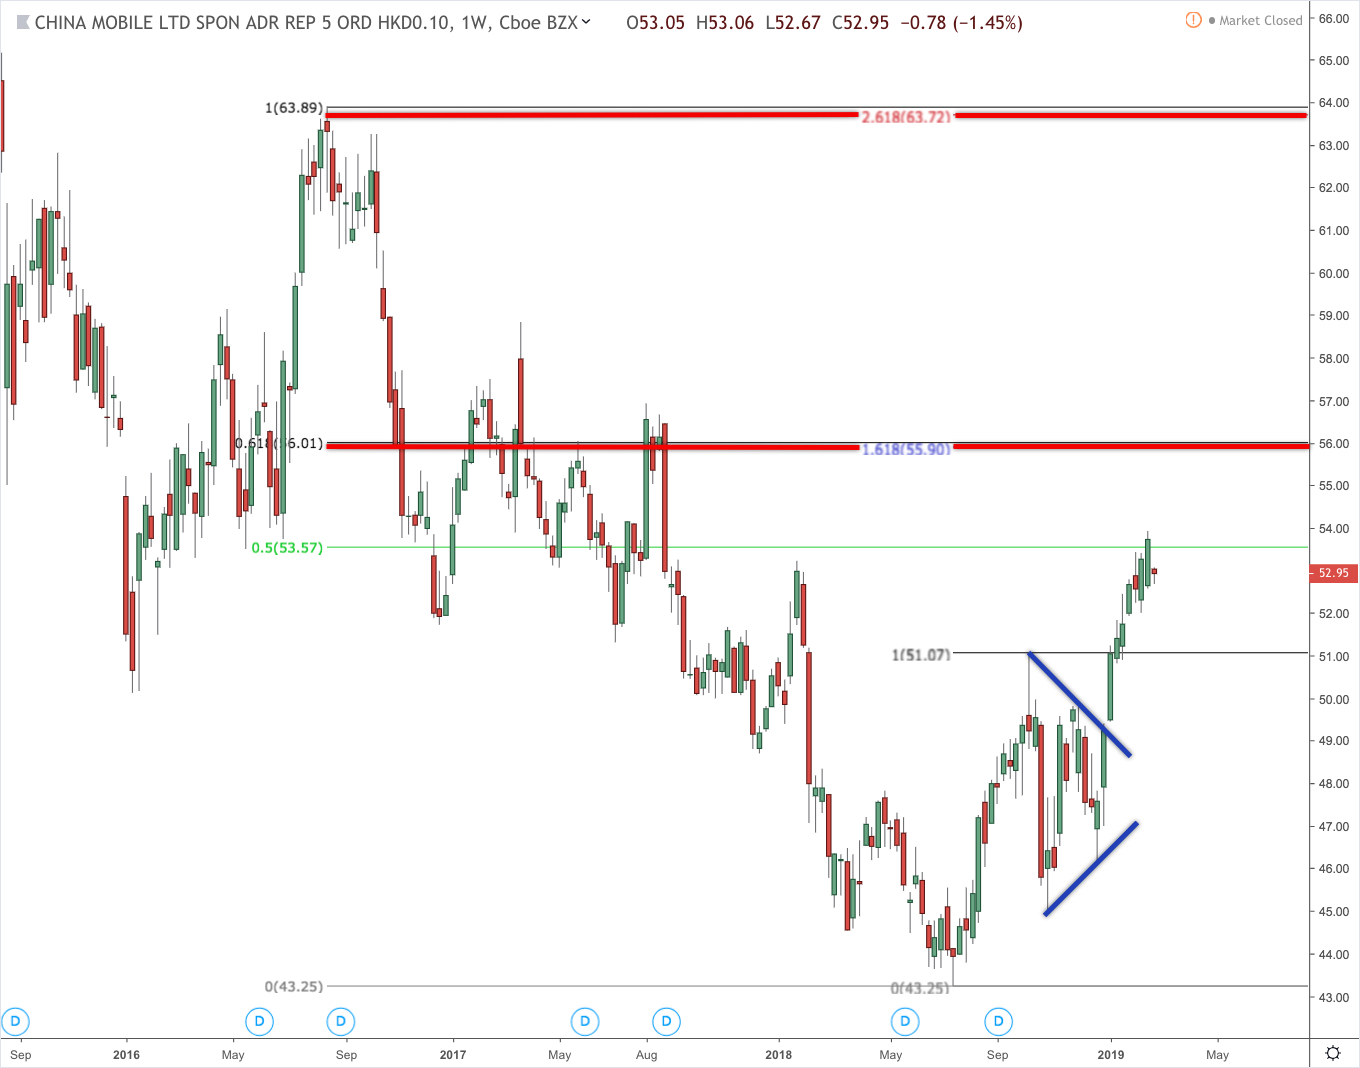
Technicals: CHL broke out of a symmetrical triangle in the beginning of January and is trading near the 50% retracement level of downtrend from mid-2016 to the mid-2018. The projection based on that pattern would give a price target around $55. That level corresponds with the 61.8% Fib retracement level and the 161.8% projection level. Based on the initial wave of this trend that began last summer, the 261.8% projection of this trend is near $64. That happens to align with the 100% retracement of the downtrend.
5. Ball Corp (BLL)— Oscar Schafer, Chairman of Rivulet Capital
Business Summary
Ball Corporation supplies metal packaging products to the beverage, personal care, and household products industries. It operates in four segments: Beverage Packaging, North and Central America; Beverage Packaging, South America; Beverage Packaging, Europe; and Aerospace. The company was founded in 1880 and is headquartered in Broomfield, Colorado.
Expert’s View
Oscar Schafer expressed that he was surprised how the global beverage-can manufacturers performed last year given their defensive nature. His recommendation was based on three considerations. The first point is the significant consolidation in that industry in recent decades. Second, the global nature of the business of BLL. BLL and Crown Holdings (CCK) represent 67% of the U.S. market, 57% of the European market and 84% of the Brazilian market. The third reason is the defensive nature of its business and its “highly resilient” business model.
Our View
Earnings: For the past 5 years BLL has generated an average revenue per share growth rate of 2.4%, which is below the 13-year median growth rate 9.5%. Earnings growth over the same period has been -5.2%, and its 3-year EPS growth rate is 8.9%. It’s median EPS growth rate over the past 13 years is 7.1%. BLL saw its earnings decline in 2015 and 2016, but the past two year has seen its earnings growth picture return to normal levels. However, the annual EPS has yet to return to 2014 levels. The current 5-year projected EPS growth rate is 11.36%, which shows an expected return to historic growth levels.
Management Effectiveness: From a management effectiveness perspective, BLL is posting a ROE of 11.97% for the trailing 12 months. The ROE is well below its 13-year median value of 29.65%. Its net profit margin of 3.9% isn’t inconsistent with defensive-oriented companies as it falls in the 57% percentile of companies in its industry.
Valuation: From a valuation perspective, BLL isn’t as attractively priced as some of the other recommendations discussed. The current EV/EBITDA is 14.92, which is higher than 69% of companies in its industry and higher than its 13-year median value of 4.09. Its current P/B ratio is 5.36, which is higher than its 13-year median value of 4.09 and is higher than 83% of the companies in its industry.
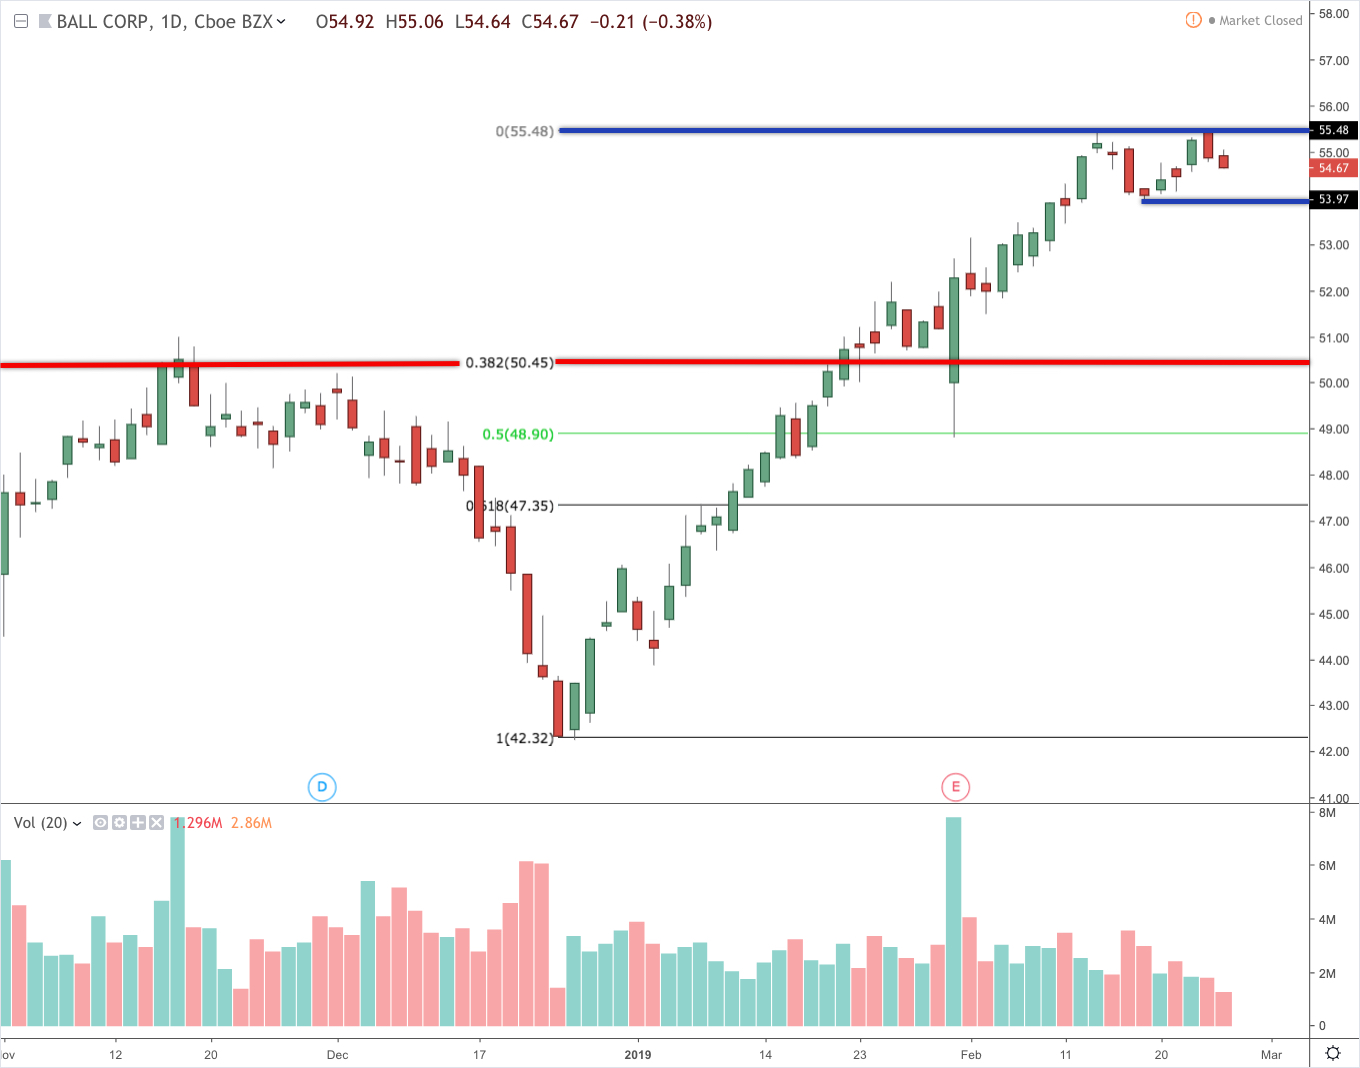
Technicals: BLL is just off its all-time high of $55.50 that it established on February 25, 2019. Year-to-date BLL has outperformed the S&P 500 by over 10%. In the near-term, BLL is in a fairly overbought position. The recent high retested a similar level that it hit on February 13, 2019. The failure to reach a higher high is an indication of a consolidation and potential correction of its trend. The light volume over this period is more of an indication of a continuation, but A close below the recent low of $53.97 would be an indication of a larger retracement of its uptrend. A potential target level would be the 38.2% retracement level near $50.50, which is also close to the 2018 high.